
AI Observability: How Do You Debug an AI Agent That Makes the Wrong Decision?
A 200 OK and a wrong answer. Traditional logs can't tell you why an agent decided what it did. Here's what to actually record, and how to trace it back.
A customer gets the wrong invoice total from your support agent. You pull the logs. They show a request came in, a response went out, 200 OK, 1.8 seconds. That's it. Nothing in that log line explains which document the agent read, which tool it called, what that tool actually returned, or why the model concluded what it concluded. The bug is real, a customer is looking at a wrong number right now, and your logs have nothing to say about why.
That's the actual problem this article is about. Traditional application logging was built for deterministic code: a function either threw an exception or it didn't, and the stack trace told you exactly where. An agent's mistake usually isn't a crash. It's a chain of individually reasonable-looking steps that added up to the wrong answer, and finding which link actually broke requires data traditional logs were never designed to capture.
The one sentence to remember
A stack trace tells you where code failed. It doesn't tell you why a model decided to do the thing it did, with the information it actually had at that moment. That's a different, harder problem, and it needs a different kind of record.
This is a practical walkthrough: what actually needs to be captured at each step of an agent's pipeline, why each piece of data answers a specific debugging question a generic log can't, and how to actually reconstruct a wrong decision after the fact instead of just knowing one happened.
The Pipeline You're Actually Debugging
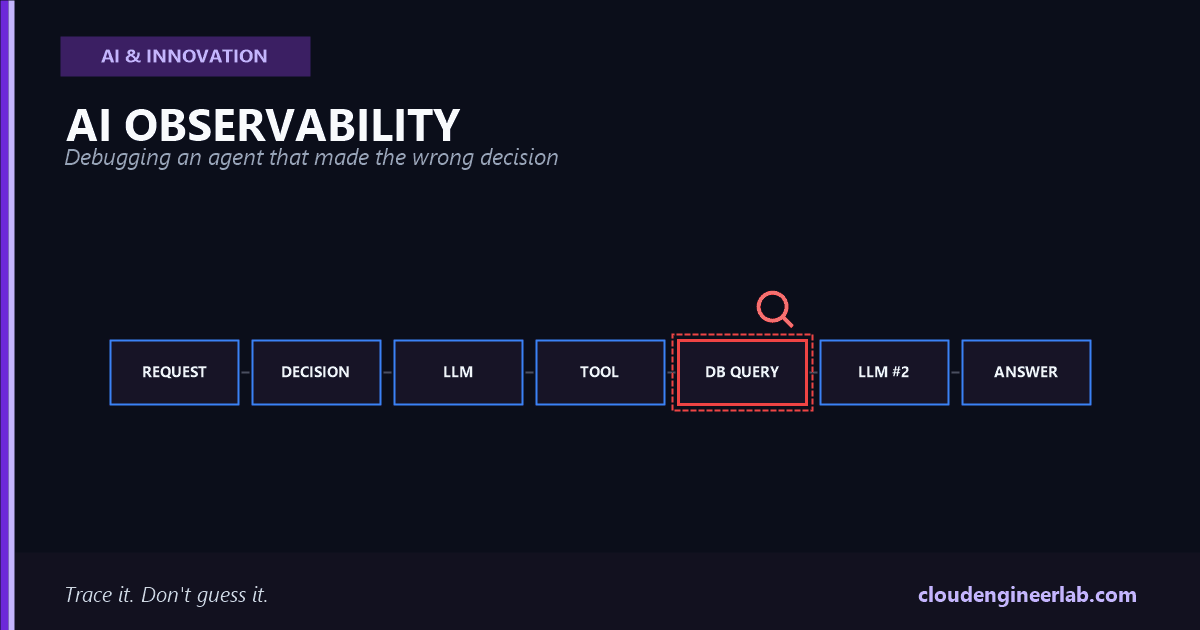
A traditional log captures the first and last box. Everything that matters is in between
"Request received, response sent" tells you the pipeline ran. It tells you nothing about which of the five steps in between is where the answer actually went wrong, and without that, every debugging session starts from zero, guessing, instead of from evidence.
The fix isn't logging more. It's capturing this pipeline as a trace: one request, one trace ID, every step along the way recorded as a connected span carrying its own specific data, so the whole causal chain can be reconstructed after the fact instead of guessed at.
What Should You Actually Record?
Eleven specific things, each answering a specific question a generic log line can't.
Token Usage
Record input, output, and cache tokens for every individual LLM call in the trace, not just a total for the whole request. This is what lets you distinguish "the model ran out of room to actually reason" from "the model had all the room it needed and still got it wrong." Those are two completely different bugs with two completely different fixes. The OpenTelemetry GenAI semantic conventions standardize this as gen_ai.usage.input_tokens and gen_ai.usage.output_tokens, specifically so this data is comparable across tools instead of locked into one vendor's dashboard format.
Latency
Record latency per span, not just end to end. A slow final answer could be a slow database query, a slow retrieval step, or a slow second LLM call, and each points to a completely different fix. Per-span latency is also what surfaces a specific, easy-to-miss failure mode: a timeout that silently truncated a tool result, producing a technically successful call that fed the model incomplete data.
Model
Record the exact model identifier used for every call in the trace, not the alias your code requested. If your system points at a "latest" alias rather than a pinned version, "it worked yesterday" becomes undebuggable the moment a provider updates what that alias actually points to. This is the same pinning discipline covered under Deployment in Building Production-Ready AI, and it starts by actually recording which version ran, on every single call.
Prompt Version
Record which specific version of the system prompt, instructions, or template was active for this trace. Without this, you cannot correlate a wording change to a shift in the kinds of mistakes the agent starts making. Prompt changes are deploys. Treat them like one in your trace data, or you'll spend hours re-deriving what should have been a one-line diff.
Tool Calls
Record the exact tool name and the exact arguments the model chose to call it with, for every tool call in the trace. This is what separates two very different bugs: the agent picking the wrong tool entirely, versus picking the right tool but constructing the wrong arguments for it. Fixing those requires touching completely different parts of your system, and you can't tell which one happened without the actual call recorded.
Tool Results
Record what a tool actually returned, the real payload, not just a boolean success flag. A wrong final answer downstream of a tool call is very often the model reasoning correctly over a tool result that was itself wrong, stale, or shaped differently than expected. "The tool call succeeded" tells you the plumbing worked. It tells you nothing about whether what came back was actually right.
Retrieved Documents
For any step backed by retrieval, record exactly which documents or chunks came back, and their relevance scores. This is, in practice, the single most common root cause of a "wrong" agent decision: not a reasoning failure at all, but a retrieval failure, the correct document was never fetched, so the model never had a chance to get the answer right in the first place. Checking retrieval first, before assuming a reasoning bug, saves enormous debugging time.
Agent Decisions
Record the model's own stated intermediate reasoning, not only its final action. Both LLM calls in this pipeline can produce an explicit rationale for what they're about to do next. Capturing that reasoning is what lets you see the actual moment logic diverged from what you'd expect, instead of only seeing the final action and having to guess backward at the thinking that produced it.
Errors
Record every error, including the ones that were retried and eventually succeeded. A recovered error can still explain a degraded final answer, extra latency, a fallback path that returned a less complete result, a retry that used a different tool. Record the error type as a structured category, not a raw string, so you can distinguish retryable failures from ones that needed a different approach entirely, the same distinction covered under Failure Recovery in AI Agents Are Not Chatbots.
Cost
Record cost per trace, not only as an aggregate across your whole system. Aggregate cost tells you what you're spending. Per-trace cost lets you find the specific requests that were both expensive and wrong, a distinct and valuable signal for prioritizing what to fix first, separate from either generic quality complaints or a generic rising bill.
Evaluation Scores
Attach an evaluation or quality score directly to the same trace it was scored against, not to a disconnected eval run in a separate system. This is what actually closes the loop: instead of knowing "3% of sampled traffic scored poorly this week," you can open the exact trace behind any one of those scores and see, step by step, what actually happened. This is the evaluation practice from Building Production-Ready AI connected directly to the debugging workflow, not sitting next to it in a different tool.
Where Each Piece of Data Actually Belongs
| Pipeline stage | What gets attached here |
|---|---|
| User Request | The original input, a trace ID that ties everything downstream together |
| Agent Decision | The orchestrator's plan, which path it chose to take and why |
| LLM Call | Model, prompt version, token usage, latency, the reasoning produced |
| Tool Call | Tool name, exact arguments, latency |
| Database Query | The retrieved documents or rows, relevance scores where applicable, latency, any error |
| Second LLM Call | Model, prompt version, token usage, latency, the reasoning produced, now conditioned on the tool result |
| Final Answer | The output shown to the user, total cost, total latency, any evaluation score attached after the fact |
Reconstructing a Wrong Decision
Start at the final answer, and check the evaluation score first
If an evaluation score is already attached to the trace, it tells you this specific request was already flagged, and roughly how, before you've read a single span.
Check retrieved documents before assuming a reasoning bug
This catches the most common root cause fastest. If the right document was never retrieved, everything downstream of that point was the model doing its best with incomplete information, not a model failure at all.
Read the tool results, not just the tool calls
Confirm the tool was called correctly, then confirm what it actually returned matched what you'd expect. A correctly-called tool can still hand back a surprising result.
Read the model's own stated reasoning at each LLM call
This is where you actually see the decision get made, not just its downstream effect. Compare what the model said it was doing against what the retrieved documents and tool results actually supported.
Check whether anything changed
Model version, prompt version, and any error-and-retry in the trace are your last checks: did this fail because of the data in this specific request, or because something about the system itself shifted recently.
This order matters
Checking retrieval and tool results before diving into the model's reasoning saves the most time, because a large share of "wrong decisions" turn out to be correct reasoning applied to incomplete or wrong information, not a flaw in the reasoning itself.
Why This Isn't Just "More Logging"
The distinction that actually matters
A log is a line of text about an event. A trace is a connected, structured record of an entire request's causal path, every span sharing an ID that lets you walk from the final answer all the way back to the original input. You can grep a pile of logs for a keyword. You cannot reconstruct a decision from them, because nothing ties one log line to the specific request, the specific tool result, and the specific reasoning step that produced it.
This is also why sampling matters more carefully here than in traditional logging. Sampling every trace at full detail is expensive at scale, but sampling too aggressively means the one trace behind a customer complaint might be the one you didn't keep. A common, practical middle ground: capture full traces for anything flagged by an evaluation score or an error, and sample a smaller, representative percentage of otherwise-healthy traffic for ongoing quality monitoring.
The Bottom Line
As AI moves from a demo a few people tested to a system making real decisions in production, "it usually works" stops being good enough, and "here's exactly what happened on this specific request" becomes a requirement, not a nice-to-have. Traditional logs were built for software that either runs or crashes. An agent's mistakes live in the reasoning between those two states, in a document that was never retrieved, a tool result the model trusted a little too much, a prompt version nobody remembered changing.
The test to run against your own system
Pick any AI-generated answer your system produced today. Try to answer, using only what you currently record: which documents it retrieved, which tools it called with what arguments, what those tools actually returned, and what the model's own reasoning was at each step. If you can't answer all four, that's not a monitoring gap to get to eventually. That's the actual reason the next wrong decision will take hours to debug instead of minutes.
The agent made a decision. Your job is making sure you can always find out why.

Written by
Chetan Yamger
Cloud Engineer · AI Automation Architect · Modern Workplace Consultant
Cloud Engineer, AI Automation Architect, and Modern Workplace Consultant based in Amsterdam, Netherlands. Specializing in scalable, secure enterprise solutions with Microsoft Azure, Intune, PowerShell, and AI-driven automation using ChatGPT, Gemini, and modern LLM technologies.
Stay in the loop.
New articles, straight to you.
Deep-dive technical articles on Intune, PowerShell, and AI — no noise, no spam.
Discussion
Share your thoughts — your email stays private
Leave a comment