
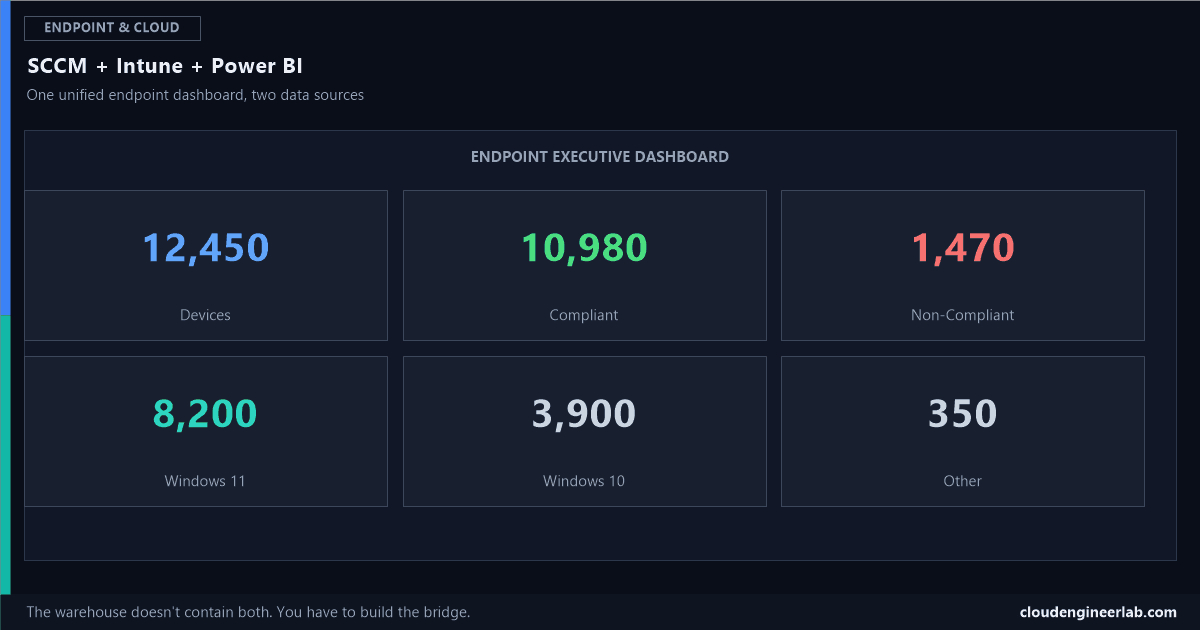
SCCM + Intune + Power BI: Build a Unified Endpoint Dashboard
Configuration Manager and Intune are two separate data sources, not one warehouse. Here's how to actually bring them together into a single, trustworthy dashboard.
The first Intune Power BI dashboard connected to one data source. This one starts from a fact that trips up a lot of otherwise solid reporting projects: the Intune Data Warehouse does not contain Configuration Manager data. They are two entirely separate systems, with two separate data stores, and if your organisation still runs co-management or a hybrid fleet, a single-source dashboard is only ever telling half the story. Bringing them together properly, not just side by side, is what this post is actually about.
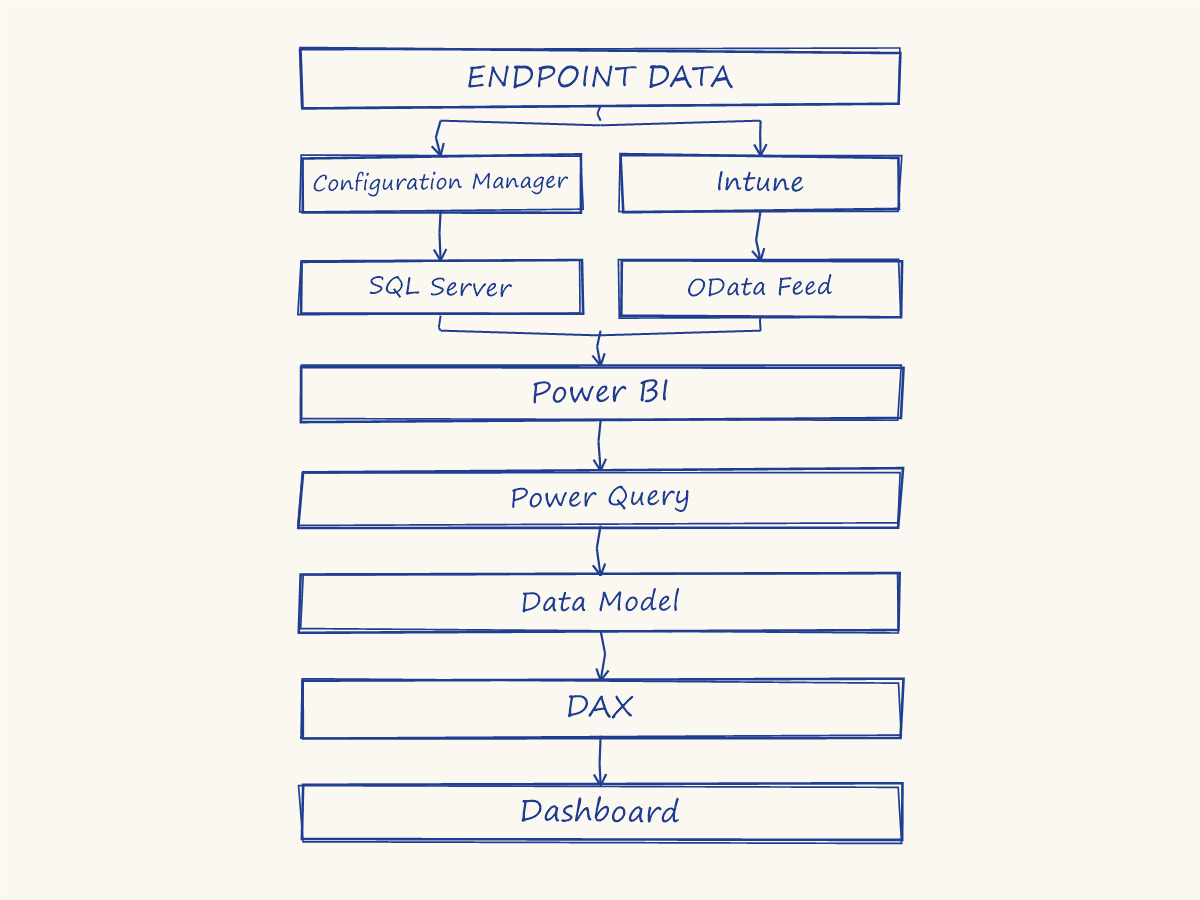
Step 1: Prepare Configuration Manager
Identify the site database
Every Configuration Manager site has a SQL Server database, commonly named CM_<SiteCode>. You'll need the SQL Server instance name and this database name before Power BI can connect to anything.
Understand supported SQL views, not raw tables
Configuration Manager exposes reporting-safe SQL views, prefixed v_, v_R_System (device inventory), v_GS_OPERATING_SYSTEM (OS details from hardware inventory), v_UpdateComplianceStatus (patch compliance), v_CICurrentComplianceStatus (configuration item compliance), v_Application (deployed applications). These views exist specifically so Microsoft can restructure the underlying tables between versions without breaking every report built on top of them.
Identify the data you actually need, before you connect
Configuration Manager's schema is large. Decide up front which views map to the dashboard pages in Step 8, rather than importing broadly and filtering later.
Never query or modify the underlying tables directly
The raw tables behind these views are unsupported and can change structure at any Configuration Manager update, silently breaking a report built against them. Worse, direct writes against the site database can corrupt site operation entirely. Views are the only supported surface for reporting, full stop.
Step 2: Prepare Intune
Go to the Intune admin centre
Reports → Data warehouse.
Copy the tenant-specific OData feed URL
The full walkthrough of this step, and what the warehouse actually contains, is covered here. This is Microsoft's documented, supported route for connecting Power BI to Intune's reporting data, the same way views are the supported route into Configuration Manager.
Step 3: Connect Power BI to SCCM SQL
Power BI Desktop → Get Data → SQL Server
Enter the Configuration Manager SQL Server instance and the site database.
Choose Import, not DirectQuery, for a first build
DirectQuery keeps data live but pushes every visual interaction into a live query against production SQL. For a first version of this dashboard, Import mode against a scheduled refresh is the safer, more predictable starting point.
Select only the supported views identified in Step 1
Not the full table list Power BI's navigator will happily show you. Selecting raw tables here is the single most common way this kind of project quietly becomes unsupported.
Step 4: Connect Power BI to Intune
Get Data → OData Feed
Paste the URL copied in Step 2.
Sign in with an Organizational Account
The full connection walkthrough, including entity selection, is here, this half of the model doesn't change from the single-source version.
Step 5: Clean the Data
Remove unnecessary columns from both sources
Every column you don't need is a column that has to be reconciled or explained later. Trim aggressively in Power Query, on both the SCCM and Intune queries.
Rename columns for consistency across both sources
v_R_System and the Intune devices entity will not use the same column names for the same concept. Standardise now, Device Name, Operating System, Compliance Status, so later DAX doesn't have to compensate for naming drift.
Fix data types explicitly
Dates as Date, not Text, on both sides, exactly as important here as in the single-source build, and easier to get subtly wrong when you're juggling two schemas at once.
Normalize device names, this is the step that actually makes the merge work
Configuration Manager and Intune don't always report the same device the same way, a fully-qualified domain name on one side, a short hostname on the other, inconsistent casing on both. In Power Query, apply Text.Upper and strip any domain suffix with Text.BeforeDelimiter(DeviceName, ".") on both queries before attempting any merge. Skipping this step is the most common reason a "unified" dashboard quietly under-counts devices that actually exist in both systems.
Merge or append where appropriate, not by default
Devices genuinely present in both systems (a co-managed fleet) call for a merge on the normalised device name. Data that's structurally the same but from non-overlapping device populations calls for an append instead. Treating every combination as a merge is how duplicate or inflated counts end up on the executive page.
Step 6: Create the Data Model
This is the section worth reading twice, because it's where most of these projects either become genuinely reliable or quietly become misleading.
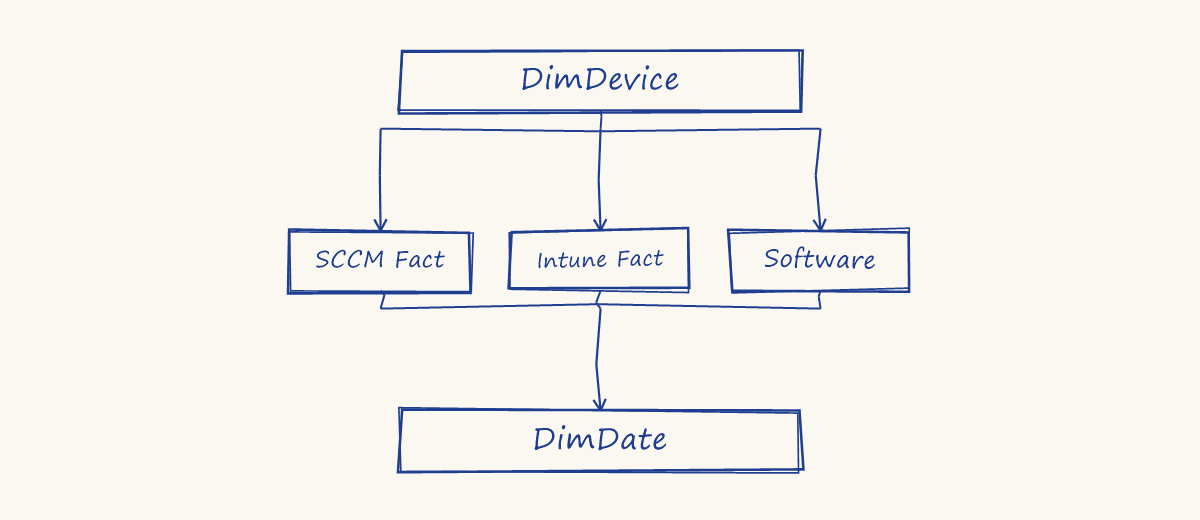
Why two fact tables, not one
SCCM and Intune data don't share a natural grain, a row in the SCCM inventory table and a row in the Intune compliance table don't represent identical events, even for the same device. Intune's own warehouse is itself built as a star schema for exactly this reason, separating facts from dimensions rather than flattening everything into one table. Forcing SCCM and Intune data into a single combined fact table hides that difference instead of modelling it honestly.
DimDevice is the shared dimension both fact tables relate to
Built from the normalised device name from Step 5, this is what lets a single device slicer filter both SCCM and Intune facts simultaneously.
SCCM Fact and Intune Fact stay separate
Each retains its own grain and its own measures. A device can have rows in one, the other, or both, and the model should represent that honestly rather than forcing a false one-to-one join.
Software is its own fact table, not bolted onto SCCM Fact
Application inventory and health data has a different grain again, one device can have many applications, so it gets its own table related back to DimDevice rather than being crammed into the device-level fact table.
DimDate ties everything to a common timeline
Every fact table relates to DimDate independently, which is what makes a trend visual spanning both SCCM and Intune data actually possible.
Why you shouldn't just join every table to everything else
It's tempting to connect every table to every other table Power BI will let you connect, "more relationships means more flexibility." In practice, multiple active relationship paths between the same two tables create ambiguous filter propagation, Power BI has to guess which path a filter should travel, and a measure can silently return a technically-valid but wrong number with no error at all. Keep exactly one active filter path between any two tables, and use USERELATIONSHIP in a specific measure on the rare occasion you deliberately need an inactive relationship activated for one calculation.
Step 7: Create DAX Measures
Total Devices =
DISTINCTCOUNT(DimDevice[Device Name])

Compliant Devices =
CALCULATE([Total Devices], 'Intune Fact'[Compliance Status] = "Compliant")

Non-Compliant Devices =
CALCULATE([Total Devices], 'Intune Fact'[Compliance Status] = "Non-Compliant")

Compliance % = DIVIDE([Compliant Devices], [Total Devices])

Windows 11 % =
DIVIDE(
    CALCULATE([Total Devices], 'SCCM Fact'[OS Version] = "Windows 11"),
    [Total Devices]
)

Windows 10 % =
DIVIDE(
    CALCULATE([Total Devices], 'SCCM Fact'[OS Version] = "Windows 10"),
    [Total Devices]
)

Devices Without Recent Check-in =
CALCULATE(
    [Total Devices],
    'SCCM Fact'[Last Hardware Scan] < TODAY() - 14
)

Application Failure % =
DIVIDE(
    CALCULATE(COUNTROWS(Software), Software[Install Status] = "Failed"),
    COUNTROWS(Software)
)
Devices Without Recent Check-in is worth more than it looks
A device that stopped checking in isn't necessarily non-compliant, it's often just stale, and a stale device can sit in a "Compliant" state indefinitely simply because nothing has re-evaluated it. This measure catches a real blind spot that the Compliance % measure alone will not.
Step 8: Build the Dashboard
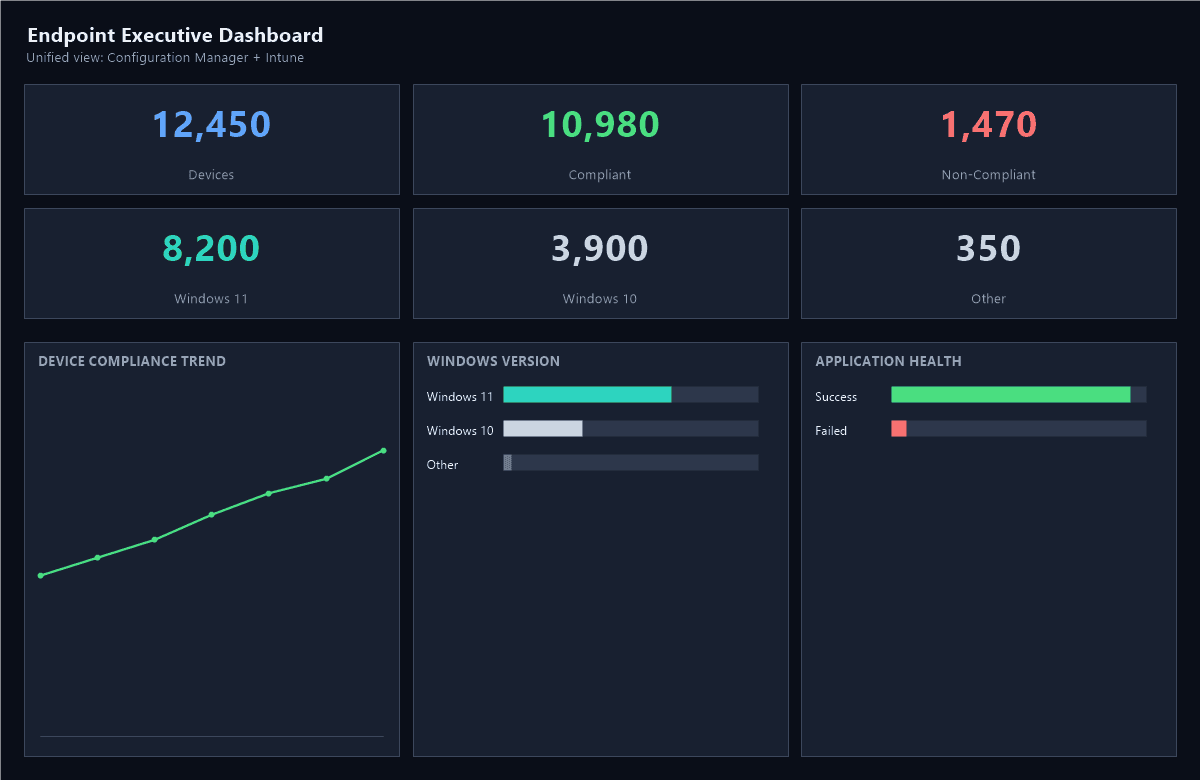
Page 1: Executive Overview
The headline numbers, total devices, compliant/non-compliant, and the OS version split, built for a five-second read by someone who isn't going to open any other page.
Page 2: Device Inventory
A searchable, filterable table view: device name, model, manufacturer, primary user, last check-in, management source.
Page 3: Compliance
A deeper cut than the executive page, compliance broken down by policy, by device group, and trended over time using DimDate.
Page 4: Windows Health
OS version distribution, update compliance from v_UpdateComplianceStatus, and the Devices Without Recent Check-in measure surfaced prominently.
Page 5: Application Health
Install success and failure rates from the Software fact table, the Application Failure % measure, and a breakdown by application to spot a specific package causing most of the failures.
Page 6: SCCM vs Intune
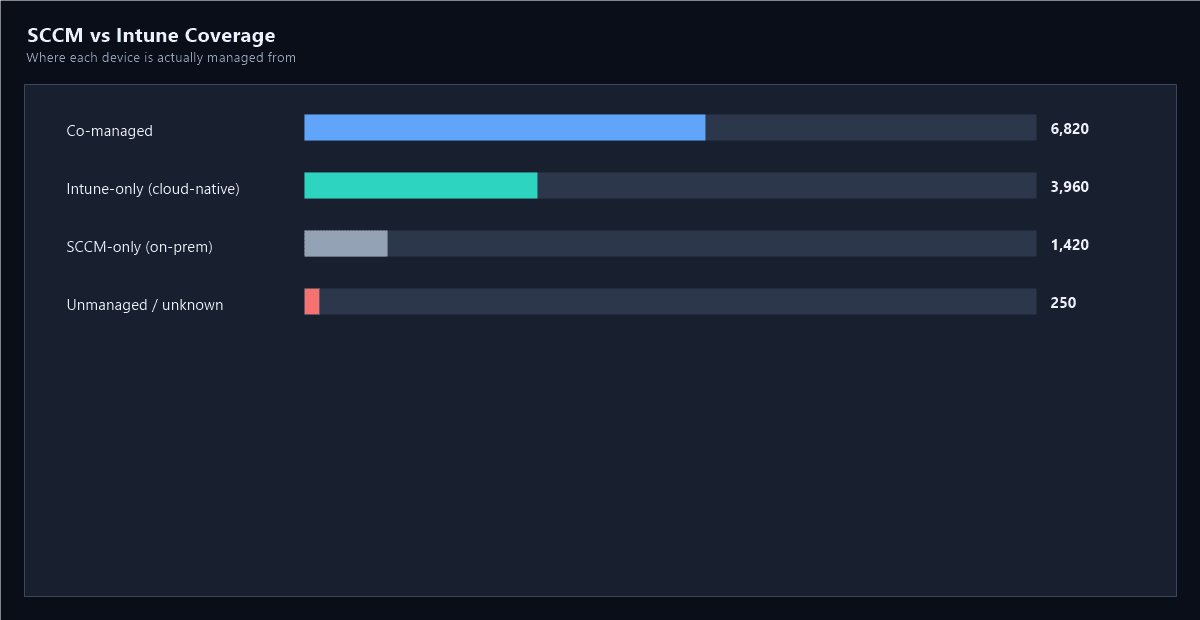
The page that only exists because of this dual-source approach: how many devices are SCCM-only, Intune-only, or genuinely co-managed, direct visibility into migration progress if you're moving from one to the other.
Page 7: Trends
Enrollment, compliance, and OS adoption over time, all sharing the same DimDate table so every trend line on the page is comparing the same timeline.
Step 9: Refresh
These two sources refresh on genuinely different models, and the dashboard should say so
SCCM SQL → Power BI Dataset → Refresh → Dashboard. This path reflects whatever's in the site database as of the last scheduled refresh, and because the SQL Server is on-premises, scheduled refresh in the Power BI Service requires an On-premises Data Gateway, something the Intune side of this model never needs.
Intune OData → Historical Warehouse Data → Power BI. The Intune Data Warehouse is downstream from Intune itself, and takes daily snapshots, not a real-time feed. Even with a perfectly configured refresh schedule, this half of the dashboard is never more current than yesterday's snapshot.
A single "Last Refreshed" timestamp on the dashboard is misleading here, it implies one consistent freshness across every visual, when in reality the SCCM-backed pages can be hours old and the Intune-backed pages are structurally at least a day old. Label each page, or each visual group, with which source it's built from and how current that source actually is, rather than letting one refresh timestamp imply a precision the underlying data doesn't have.
Summary
| Step | What it produces |
|---|---|
| 1-2. Prepare both sources | A confirmed list of supported SCCM views and the Intune OData feed URL |
| 3-4. Connect both | Two independent queries in the same Power BI file |
| 5. Clean | Normalised device names, the actual key that makes unification possible |
| 6. Model | A proper star schema: shared DimDevice, separate fact tables, one shared DimDate |
| 7. DAX | Eight measures, including two (check-in staleness, app failure rate) that neither source alone makes obvious |
| 8. Dashboard | Seven pages, including one that only makes sense because two sources exist |
| 9. Refresh | Two honestly different freshness guarantees, labelled as such |
The standout piece of this build isn't any single visual, it's Page 6. A dashboard that can actually answer "how far along is our Intune migration, right now, with real numbers" is doing something neither a Configuration Manager report nor a single-source Intune dashboard can do alone.
If you're running co-management today, what does your own SCCM vs Intune split actually look like? I'd guess most environments reading this are further along than they assume, or further behind. Drop a comment with your real numbers.

Written by
Chetan Yamger
Cloud Engineer · AI Automation Architect · Modern Workplace Consultant
Cloud Engineer, AI Automation Architect, and Modern Workplace Consultant based in Amsterdam, Netherlands. Specializing in scalable, secure enterprise solutions with Microsoft Azure, Intune, PowerShell, and AI-driven automation using ChatGPT, Gemini, and modern LLM technologies.
Stay in the loop.
New articles, straight to you.
Deep-dive technical articles on Intune, PowerShell, and AI — no noise, no spam.
Discussion
Share your thoughts — your email stays private
Leave a comment