
The 15 Power BI Reports Every SCCM and Intune Administrator Should Build
Fifteen named reports, the exact business question each one answers, and the data source, DAX, and visualization that actually deliver it.
Most environments end up with two or three Power BI reports built ad hoc, usually whatever a specific incident made someone need urgently. The single-source OData build and the unified SCCM plus Intune dashboard covered the mechanics. This is the actual portfolio, fifteen named reports, organised by what they cover, each one starting from a real business question rather than from whatever data happened to be easiest to pull.
Report
  ↓
Business Question
  ↓
Data Source
  ↓
SQL / OData
  ↓
Power Query
  ↓
DAX
  ↓
Visualization
Start from the question, not the data
The most common way a Power BI project stalls is building outward from "what fields does this entity have" instead of inward from "what does someone actually need to know." Every report below leads with its business question specifically to break that habit. If you can't state the question in one sentence, it isn't ready to build yet.
Device Reports
These pull from both Configuration Manager and Intune where a device could plausibly be managed by either, the normalisation and merge technique that makes this possible is covered in full here.
1. Device Inventory
Business question: What devices do we actually have, and what do we know about each one?
| Data source | Intune devices entity, SCCM v_R_System and v_GS_COMPUTER_SYSTEM |
| Key DAX | Total Devices, Devices by Manufacturer |
| Visualization | A filterable table or matrix, this is a lookup report, not a chart report |
2. Windows Version Distribution
Business question: How fragmented is our OS fleet, and how much of it is on a version that's actually still supported?
| Data source | SCCM v_GS_OPERATING_SYSTEM, or the Intune devices OS version field |
| Key DAX | Windows 11 %, Windows 10 % |
| Visualization | Donut chart for the headline split, bar chart if build numbers matter more than major versions |
3. Windows 11 Readiness
Business question: Which devices can't upgrade yet, and specifically why not?
| Data source | SCCM hardware inventory views, v_GS_TPM, v_GS_PROCESSOR, v_GS_X86_PC_MEMORY |
| Key DAX | Readiness %, Devices Failing TPM Check |
| Visualization | A stacked bar broken down by specific failure reason (TPM, CPU generation, RAM), not just a pass/fail count |
TPM is usually the actual blocker, not CPU generation
The hardware chain of trust Windows 11 depends on is covered in full here. In most real fleets, devices failing readiness fail on TPM 2.0 presence specifically, not processor generation, which changes the remediation conversation from "budget for new hardware" to "check a firmware setting" for a meaningful chunk of the failing population.
4. Stale Devices
Business question: Which devices have gone dark, and are they lost, decommissioned, or just broken?
| Data source | Last hardware scan (SCCM) or last check-in (Intune) |
| Key DAX | Devices Without Recent Check-in |
| Visualization | A table sorted by days since last contact, the ranking itself is the insight |
5. Recently Enrolled Devices
Business question: What's our onboarding velocity, and are new devices enrolling cleanly?
| Data source | Intune enrollments entity, SCCM discovery date |
| Key DAX | New Enrollments This Month |
| Visualization | A column or line chart trended over time |
Intune Reports
1. Compliance Dashboard
Business question: Are we actually secure, fleet-wide, right now?
| Data source | deviceCompliancePolicyStates |
| Key DAX | Compliance % |
| Visualization | A gauge or donut for the headline number, a matrix by policy for the drill-down |
Label this report honestly
Compliance is a checklist, not a security guarantee. This report answers "are we configured the way we require," not "are we currently secure." Naming it precisely on the dashboard itself prevents it from being read as a stronger claim than it actually makes.
2. Enrollment Trends
Business question: Is our cloud migration actually progressing, or has it plateaued?
| Data source | enrollments entity, related to the dates dimension |
| Key DAX | A cumulative running total over New Enrollments This Month |
| Visualization | A line chart, this is the one report on this list where the trend matters more than any single point |
3. Application Deployment Status
Business question: Did this specific app actually reach the devices it was targeted to?
| Data source | Intune app assignment and install-status data |
| Key DAX | Install Success % |
| Visualization | A stacked bar per application, success versus failure versus pending |
4. Failed Application Installations
Business question: Which app, and which specific error, is generating the most support load right now?
| Data source | The same assignment entity, filtered to failed status, grouped by error code |
| Key DAX | Application Failure % |
| Visualization | A table sorted by failure count, error code included, not hidden behind an aggregate |
5. Policy Deployment Status
Business question: Did our configuration profiles and compliance policies actually apply where they should have?
| Data source | deviceConfigurationStates |
| Key DAX | A success-rate measure parallel to Install Success %, scoped to policy application instead of app installation |
| Visualization | A matrix crossing policy against device group, this is where a policy that's silently failing for one specific group hides in a flat report and stands out in a matrix |
SCCM Reports
1. Collection Membership
Business question: Who's actually in this collection right now, and is membership evaluation keeping up with reality?
| Data source | v_ClientCollectionMembers, v_Collection |
| Key DAX | A simple membership count, the value here is the underlying detail table, not a clever measure |
| Visualization | A table, filterable by collection |
2. Software Inventory
Business question: What's actually installed across the fleet, the question that matters for both licensing and security?
| Data source | v_GS_INSTALLED_SOFTWARE or v_Add_Remove_Programs |
| Key DAX | Install count by title |
| Visualization | A ranked bar chart, top N titles by install count, with a search-filterable table underneath |
3. Application Deployment Status (SCCM)
Business question: Did the SCCM-deployed application succeed, tracked separately from anything deployed through Intune?
| Data source | SCCM deployment status views |
| Key DAX | Deployment Success %, scoped specifically to the SCCM fact table |
| Visualization | A bar chart per deployment, kept on its own page rather than merged with the Intune application report, for the same grain reasons covered in the star schema design |
4. Client Health
Business question: Is the Configuration Manager client itself actually functioning, a genuinely different question from whether the device is compliant?
| Data source | v_CH_ClientSummary |
| Key DAX | Active Client % |
| Visualization | A donut for the headline split, a trend line if client health has been degrading gradually rather than failing all at once |
5. Software Update Compliance
Business question: Are devices actually patched against the current update baseline?
| Data source | v_UpdateComplianceStatus |
| Key DAX | An update compliance percentage, scoped per update or per baseline |
| Visualization | A matrix crossing update against device group, the same pattern as Policy Deployment Status, for the same reason, a baseline that's failing for one group only is invisible in an aggregate |
Building These in the Right Order
Start with Compliance Dashboard and Device Inventory
These two answer the questions asked most often, in meetings, by auditors, by your own team troubleshooting a specific device. Build them first.
Add Stale Devices and Client Health next
Both surface a genuinely different failure mode than compliance does, a device that's quietly stopped participating at all, which a pure compliance view can't see.
Save the two SCCM-vs-Intune-specific reports for when both sources are actually connected
Application Deployment Status (SCCM) and the broader Intune equivalent only earn their keep once the dual-source model from the unified dashboard post is actually in place.
Treat Windows 11 Readiness as a project report, not a permanent fixture
Build it, drive the number to where it needs to be, and either retire it or fold it into Windows Version Distribution once the migration itself is done.
Summary
| Category | Reports |
|---|---|
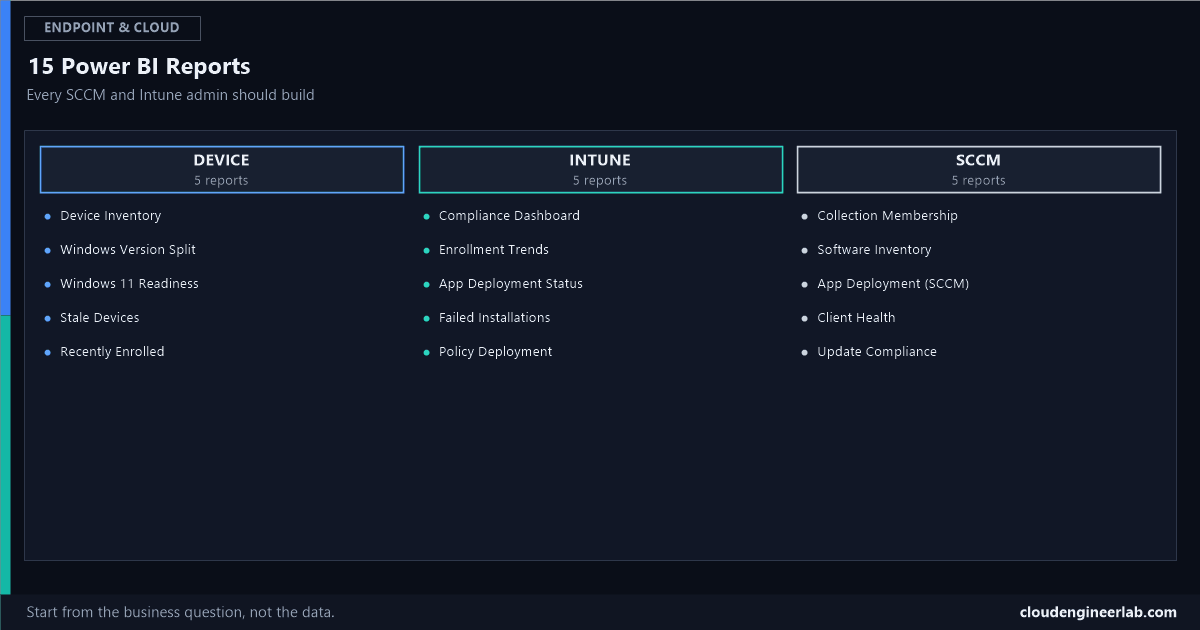
| Device | Device Inventory, Windows Version Distribution, Windows 11 Readiness, Stale Devices, Recently Enrolled Devices |
| Intune | Compliance Dashboard, Enrollment Trends, Application Deployment Status, Failed Application Installations, Policy Deployment Status |
| SCCM | Collection Membership, Software Inventory, Application Deployment Status, Client Health, Software Update Compliance |
Fifteen reports is a portfolio, not a single dashboard, and that's deliberate. A single page trying to answer all fifteen questions at once answers none of them well. Build these as a genuine set of pages, or a genuine set of reports, each one earning its place by the specific question it answers, not by how much data it happens to show.
Which of these fifteen do you already have built, and which one is still missing that probably shouldn't be? Failed Application Installations is the one I see skipped most often, usually because Application Deployment Status feels like it already covers it. It doesn't, not with the specific error code detail a support team actually needs. Drop a comment with your own gap.

Written by
Chetan Yamger
Cloud Engineer · AI Automation Architect · Modern Workplace Consultant
Cloud Engineer, AI Automation Architect, and Modern Workplace Consultant based in Amsterdam, Netherlands. Specializing in scalable, secure enterprise solutions with Microsoft Azure, Intune, PowerShell, and AI-driven automation using ChatGPT, Gemini, and modern LLM technologies.
Stay in the loop.
New articles, straight to you.
Deep-dive technical articles on Intune, PowerShell, and AI — no noise, no spam.
Discussion
Share your thoughts — your email stays private
Leave a comment