
Enterprise Endpoint Analytics with Power BI: Building a Single Source of Truth
Not another dashboard. One governed model, one refresh strategy, one set of numbers everyone actually trusts, with three different reports built on top of it.
Every post so far in this series built one report end to end. The single-source OData build, the unified SCCM plus Intune dashboard, the application deployment deep dive, each one is a .pbix file, built once, by one person. That approach breaks the moment a second team wants their own view of the same data: someone copies the file, rebuilds the Power Query steps slightly differently, writes a DAX measure with a subtly different filter, and six months later Security and Operations are arguing over whose compliance number is correct, when the real problem is that there were never one set of numbers to begin with.
This post is the fix: not a bigger dashboard, a platform. One governed model, built once, that every downstream report connects to instead of rebuilding.
Instead of the pattern most organisations default to:
SCCM Reports
Intune Reports
Excel
Power BI
Manual Reports
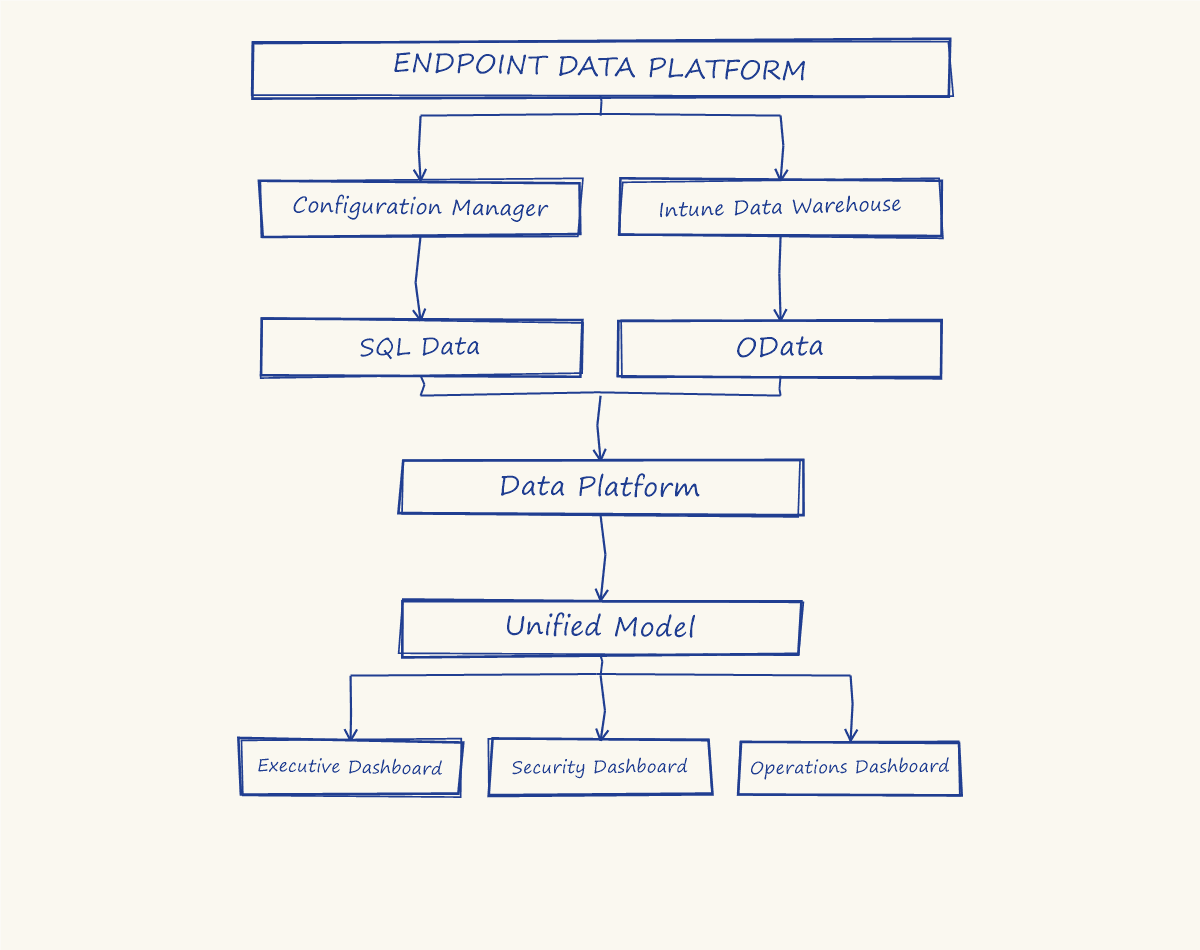
The actual architecture:
Data Architecture: Why a Platform, Not a Dashboard
The core architectural decision
A single source of truth doesn't mean one dashboard. It means one semantic model, published once to a Power BI workspace, that Executive, Security, and Operations reports all connect to live, rather than each rebuilding their own copy of the same transformations and measures. When the Compliance % measure needs to change, it changes once, in one place, and every report downstream of it updates automatically.
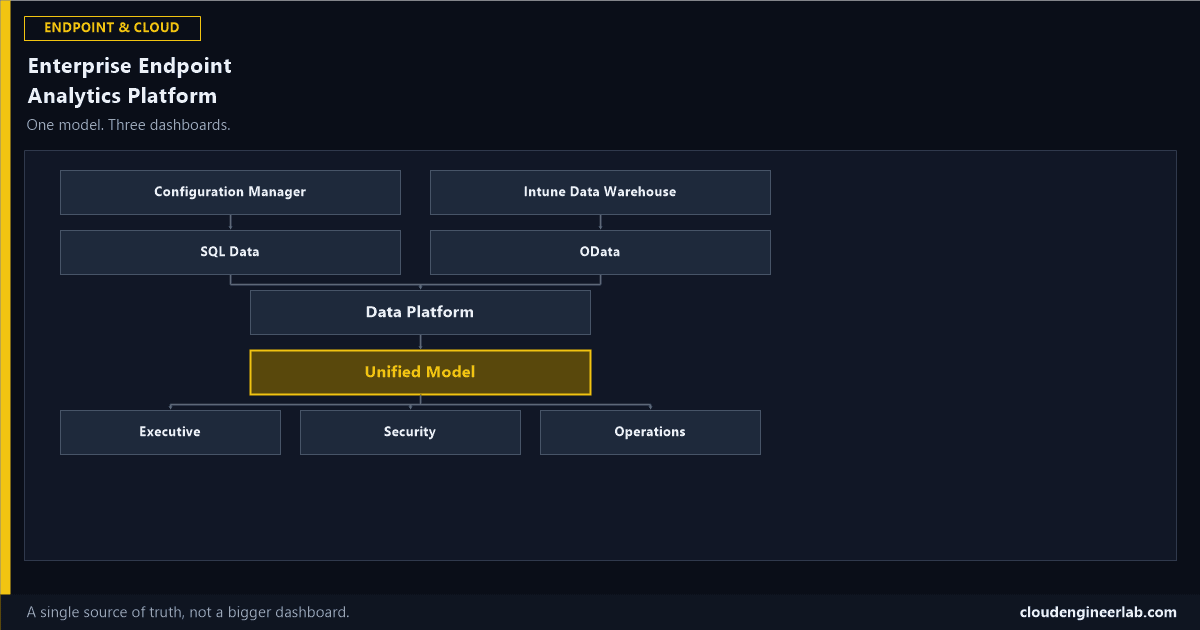
The platform has four layers: extraction (SQL and OData, pulling from Configuration Manager and Intune), a shared data platform layer (staging both sources before modelling), one unified model (the actual governed semantic model), and finally, multiple reports built on top of that single model rather than on top of the raw sources directly.
Data Extraction: SQL and OData
The mechanics of both connections, Configuration Manager's supported SQL views and the Intune Data Warehouse's OData feed, are covered in full here. At platform scale, the only thing that changes is discipline: every extraction query is built once, in one shared location, not copy-pasted into every new report that needs the same tables.
Transformation: Power Query as a Shared Layer
Column renaming, type-fixing, and device-name normalisation happen exactly once here too. Power BI Dataflows are the practical mechanism for this: a Power Query transformation published as its own reusable object, so a report author building the Security dashboard consumes already-cleaned data instead of re-running the same normalisation logic a fourth time.
Data Model: One Star Schema, Not One Per Report
The star schema pattern, shared DimDevice, separate SCCM and Intune fact tables, a shared DimDate, becomes the Unified Model at platform scale, published as its own dataset, independent of any single report.
DAX: Centralised Measures, Not Duplicated Logic
Every measure, Compliance %, Success Rate, Detection-Only Failures, lives in the Unified Model exactly once. A report author building a new visual picks an existing measure off the shelf. They don't write a new one with slightly different logic, which is precisely how two dashboards end up disagreeing about a number that should be identical.
Incremental Refresh
A fact table holding years of enrollment or compliance history doesn't need to fully reprocess on every refresh. Incremental refresh partitions the table by date, refreshing only a recent window (the last few days) on the regular schedule, and leaving historical partitions untouched until a much less frequent full refresh. At platform scale, with multiple years of history behind the Unified Model, this is the difference between a refresh that takes minutes and one that takes hours.
Gateway
Configuration Manager's SQL Server is on-premises. Scheduled refresh in the Power BI Service requires an On-premises Data Gateway to reach it. At platform scale, that single gateway becomes a genuine dependency for every downstream report, which is why production platforms run gateways in a cluster, multiple gateway instances sharing the load, so one server being patched or rebooted doesn't stall every scheduled refresh behind it.
Security and Row-Level Security
Why one shared model needs RLS, not three separate reports
Without row-level security, giving a regional IT manager visibility into the platform means either granting them access to everything, or building them their own separate, filtered report, exactly the duplication this whole platform exists to avoid. Row-level security (RLS) solves this properly: a role defined once in the Unified Model, filtering DimDevice by region, so the same report shows different rows to different signed-in users, no duplicate report required.
Workspace Architecture
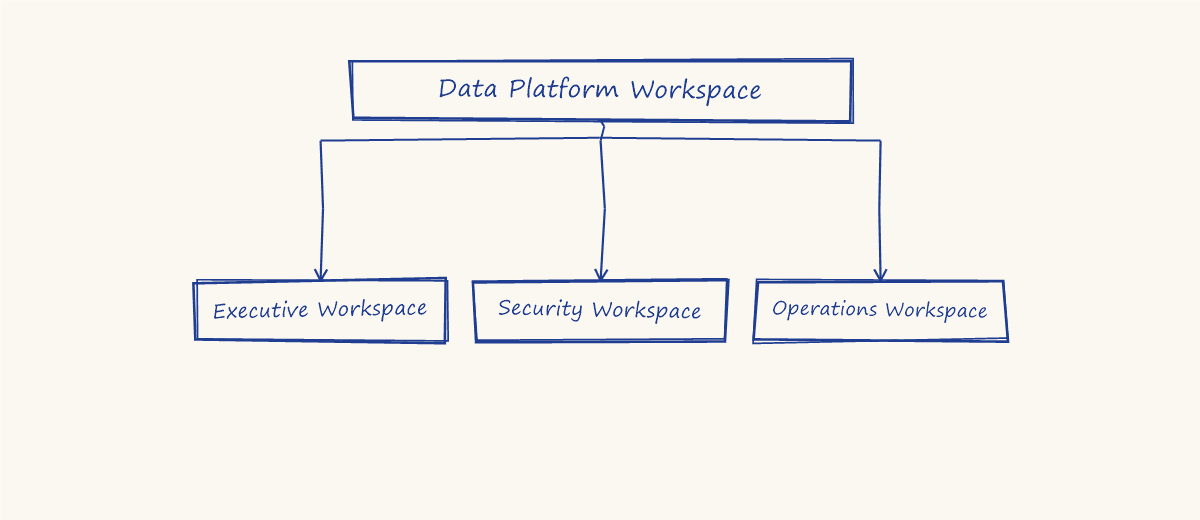
A Data Platform workspace holds the Unified Model and nothing else, owned by the team responsible for its accuracy. Separate reporting workspaces, one per audience, hold the actual reports, each connecting back to that shared model rather than housing their own copy of it. This separation is what makes independent report ownership possible without independent, drifting data models.
Report Ownership
The model has one owner: the platform or BI team accountable for its accuracy, its refresh, and its measures. Each report has a different owner: the Security team owns the Security dashboard's layout and visuals, without ever touching the underlying model. This split is what keeps a platform maintainable as it grows past a handful of reports.
Data Refresh, Orchestrated
Individual source refresh models are covered in depth here, SCCM's gateway-dependent SQL refresh, Intune's downstream daily snapshot. At platform scale, these need explicit sequencing: the Unified Model's refresh shouldn't kick off until both source extractions have actually completed, not on an independent timer that might catch one source mid-update.
Monitoring
A platform needs to know when it breaks before a report author does. Power BI's admin and capacity monitoring surfaces refresh failures, refresh duration trends, and dataset size growth over time, the same instinct as the ongoing Monitoring phase in the Zero Trust program roadmap, a control that isn't watched isn't actually a control.
Performance
A large shared model serving multiple reports has to stay responsive for all of them. The practical levers: avoid bi-directional relationship filtering across large fact tables (the same ambiguous-filter-path problem covered in the data model post), pre-aggregate where a visual genuinely doesn't need row-level detail, and keep Import mode as the default rather than reaching for DirectQuery unless a specific report genuinely needs live data over model performance.
Governance
The unglamorous work that actually makes this last
Naming conventions applied consistently across the model. A single, documented owner for every measure. A certified or promoted endorsement on the Unified Model in the Power BI Service, so anyone building a new report can tell, at a glance, that this is the dataset to connect to, not one of several similarly-named candidates. None of this is visible in a single screenshot of a dashboard, and all of it is the actual reason the platform is still trustworthy a year after launch instead of having quietly forked into three disagreeing copies again.
Summary
| Layer | What lives here | Owned by |
|---|---|---|
| Extraction | SQL views, OData feed | Platform/BI team |
| Data Platform | Shared Power Query dataflows | Platform/BI team |
| Unified Model | Star schema, DAX measures, RLS roles | Platform/BI team |
| Executive Dashboard | Report, visuals | Executive stakeholder |
| Security Dashboard | Report, visuals | Security team |
| Operations Dashboard | Report, visuals | Operations team |
The difference between "how to build a Power BI report" and "how an enterprise designs endpoint analytics" isn't a bigger dashboard. It's this table, one governed layer that changes rarely and is owned deliberately, and multiple report layers that change often and are owned by the people who actually use them.
Is your organisation's endpoint reporting still one dashboard per team, each with its own numbers, or has it consolidated onto a shared model like this? The RLS step is the one I see skipped most often, usually because the first version of the platform only had one audience and nobody planned for the second. Drop a comment with where yours sits today.

Written by
Chetan Yamger
Cloud Engineer · AI Automation Architect · Modern Workplace Consultant
Cloud Engineer, AI Automation Architect, and Modern Workplace Consultant based in Amsterdam, Netherlands. Specializing in scalable, secure enterprise solutions with Microsoft Azure, Intune, PowerShell, and AI-driven automation using ChatGPT, Gemini, and modern LLM technologies.
Stay in the loop.
New articles, straight to you.
Deep-dive technical articles on Intune, PowerShell, and AI — no noise, no spam.
Discussion
Share your thoughts — your email stays private
Leave a comment