
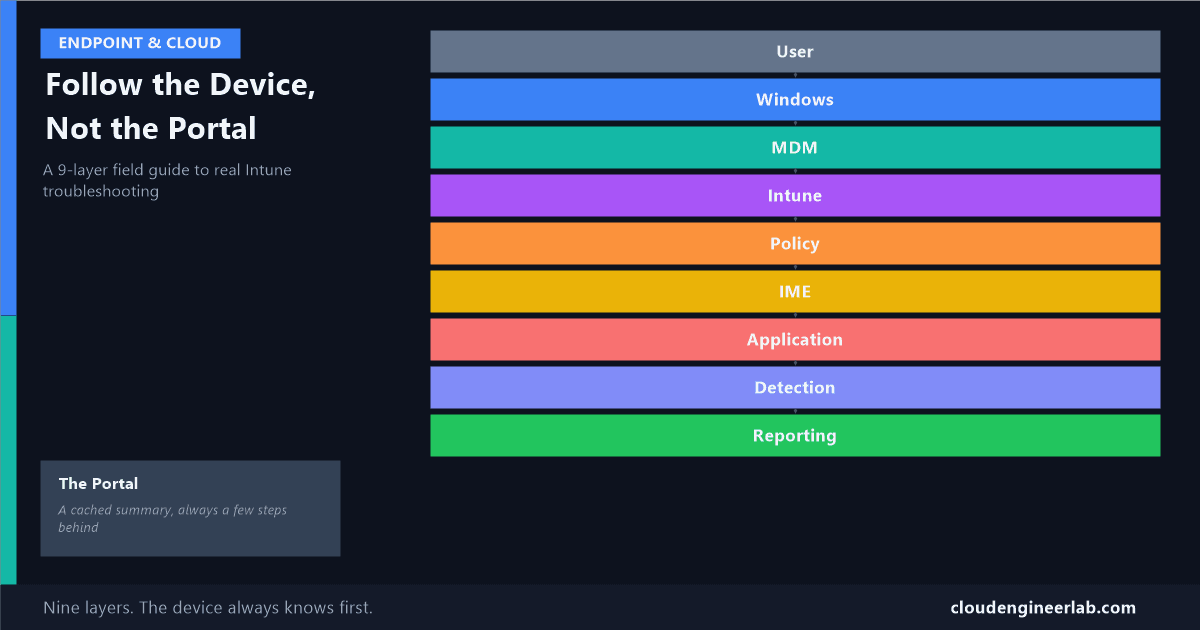
Intune Troubleshooting: Follow the Device, Not the Portal
The admin centre is a reported view assembled from several independent systems, each with its own delay. Here's where the actual truth lives, layer by layer.
The single habit that separates a fast Intune diagnosis from a two-day ticket is this: the admin centre is not where the truth lives. It's a summary, assembled from several independent systems that each report in on their own schedule, through their own channel, with their own delay. When something looks wrong in the portal, refreshing it again doesn't get you closer to an answer. Going to the actual layer that owns that truth does.
This post is a map of that stack, nine layers deep, and exactly where to look at each one when something breaks.
User
 ↓
Windows
 ↓
MDM
 ↓
Intune
 ↓
Policy
 ↓
IME
 ↓
Application
 ↓
Detection
 ↓
Reporting
Layer 1: User
Before touching any Intune-specific tool, confirm the boring thing first: which account is actually signed in, and does that match who the assignment was built for. A configuration profile assigned to a user group does nothing for a device where a different account is logged in, and a device targeted directly ignores per-user targeting entirely. Run:
whoami /upnThis is the same class of bug as the HKCU detection trap
I covered a version of this exact mismatch in why detection rules lie: a per-user setting evaluated under the wrong context produces a confident, wrong answer. Targeting has the identical failure shape, one level up the stack, before any policy or app even gets involved.
Layer 2: Windows
This is the layer people skip past fastest, and shouldn't. The operating system has its own ground truth, completely independent of what Intune's portal claims happened. There's a genuine "gpresult for MDM" hiding in Settings: Settings → Accounts → Access work or school → Info → Create report, which exports a full diagnostic bundle to C:\Users\Public\Documents\MDMDiagnostics, including every applied Policy CSP setting, certificates, configuration sources, last successful check-in, BitLocker state, and whether any Group Policy is actively being blocked by an MDM policy.
For anything even more specific, verify the actual OS-level state directly rather than trusting any report about it:
manage-bde -status # is BitLocker actually on, regardless of what any report claimsThe device doesn't care what the portal says
If a setting looks applied in Intune but the device behaves as if it isn't, this layer wins the argument every time. The portal describes what Intune believes it told the device. This layer describes what's actually true on it.
Layer 3: MDM
This is the channel the device uses to talk to Intune at all, and I've written an entire post on diagnosing it: what happens when a device stops checking in. The short version for this stack: run dsregcmd /status, confirm AzureAdJoined and AzureAdPrt are healthy, and check the EnterpriseMgmt scheduled tasks actually exist before assuming anything above this layer matters. If the device isn't reliably talking to Intune, every layer above this one is irrelevant until this one is fixed.
Layer 4: Intune (the Service)
Here's a layer most people assume is instantaneous and isn't: assignment evaluation itself has a real, measurable delay, and it depends entirely on how you're targeting.
| Assignment target | Typical propagation delay |
|---|---|
| Static Entra group | Seconds |
| Dynamic Entra group | Minutes, sometimes hours on large or complex-rule tenants |
Dynamic group membership evaluation runs asynchronously in the background. A device that was just renamed, or a user who just changed department, doesn't instantly reflect in a dynamic group's membership, and Intune can't assign what it doesn't yet see as a member.
Don't debug a policy that was never actually assigned yet
Before troubleshooting why a policy "isn't applying," confirm the target device or user is actually showing as a current member of the assigned group, in Entra, not just logically eligible for it based on the rule. A dynamic group's rule matching a device is not the same as that membership having actually propagated yet.
Layer 5: Policy
The portal's compliance and configuration profile status is a binary summary: Succeeded, Error, or Conflict. The actual application happens setting by setting, through individual Configuration Service Providers (CSPs), and a profile can report "Succeeded" overall while one specific setting inside it silently failed.
MDMDiagReport.xml, part of the same diagnostic bundle from Layer 2, contains the real granularity: a status code per CSP, per setting, not just per profile. A non-zero code on one line is your actual answer, buried inside a report the portal only shows you the summary of.
A profile with 12 settings and one silent failure still shows green
This is one of the most common gaps between "the portal says it worked" and "the user says it didn't." The portal's per-profile status genuinely can say Succeeded while a single setting inside that profile, the one your user actually cares about, has a real CSP-level error sitting in MDMDiagReport.xml the whole time.
Layer 6: IME
For anything that isn't a CSP-based configuration profile, Win32 apps, PowerShell scripts, Proactive Remediations, the Intune Management Extension is the layer doing the work, on its own separate roughly-8-hour cycle, with its own logs at C:\ProgramData\Microsoft\IntuneManagementExtension\Logs. A device can be perfectly healthy on the MDM channel above while this layer is stuck, or vice versa. Confirm each independently rather than assuming one implies the other.
Layer 7: Application
Once IME is confirmed healthy, the next question is narrower: did the install command actually run, and what did it report back. This is the exit-code layer I walked through in what actually happens after uploading a .intunewin file, running as SYSTEM in a non-interactive session by default. AppWorkload.log inside the IME logs above is the specific file for this layer, distinct from the general check-in logging.
Layer 8: Detection
This is the layer with the most misleading name in the entire stack, because "detected" doesn't mean "installed," it means "the detection rule matched." I've written a full post on exactly how this fails: MSI product codes, WOW6432Node redirection, the PowerShell STDOUT requirement, and the HKCU-under-SYSTEM trap. If Layer 7 shows a clean install but the app still shows as failed or missing, this is almost always where the real answer is, not a reason to reinstall the app again.
Layer 9: Reporting
This is the layer that explains why the entire premise of this post is true. What you see in the admin centre isn't a live feed, it's the end of a chain, and every link in that chain adds real, measurable delay:
The device evaluates and writes a local result
A compliance re-check, a detection rule, an install outcome, whatever changed.
The relevant agent reports it back on its own cycle
MDM's check-in cycle or IME's separate cycle, whichever layer produced the change.
Intune's backend ingests and aggregates it
Turning a raw device report into the state the admin centre actually queries.
Anything downstream of that has its own delay too
Compliance state flowing from the device, through Intune, into the Entra device object, to where Conditional Access can actually read it, typically takes 5 to 30 minutes end to end, sometimes longer.
This is the actual reason to check the device, not refresh the portal
If you just fixed a setting and the portal still shows the old state a few minutes later, that's very often not a bug, it's this chain still catching up. Confirming the fix at Layer 2 (the device itself) tells you immediately whether it worked. Watching the portal only tells you how far behind the reporting chain currently is.
A Worked Example
A real ticket: "Compliance policy still shows Not Compliant, but I fixed the setting 20 minutes ago."
Layer 2 first, not the portal
Check the device directly. manage-bde -status confirms BitLocker is genuinely on now. The fix worked, on the device, immediately.
Layer 5 to confirm it wasn't a partial apply
MDMDiagReport.xml shows the relevant CSP with a success code, not just the profile-level summary.
Layer 9 explains the rest
Compliance state has to flow from the device's own re-evaluation, through Intune, into the Entra device object, before Conditional Access or the portal reflects it, a chain that reasonably takes up to 30 minutes on its own.
The actual resolution
Nothing was broken. The fix worked at the moment it was applied. The ticket should have been closed at Layer 2, twenty minutes earlier, instead of staying open while someone refreshed the admin centre.
The Field Guide
| Layer | What the portal shows you | Where the real truth lives |
|---|---|---|
| User | Assigned user or group name | whoami /upn on the device |
| Windows | Nothing, this layer is invisible to the portal | Settings → Access work or school → Info → Create report |
| MDM | Last check-in timestamp | dsregcmd /status, EnterpriseMgmt scheduled tasks |
| Intune | Assignment target | Actual current group membership in Entra, not just rule eligibility |
| Policy | Succeeded / Error / Conflict | MDMDiagReport.xml, per-CSP status codes |
| IME | Last sync time | IntuneManagementExtension.log |
| Application | Install status | AppWorkload.log, the real exit code |
| Detection | Installed / Not installed | The detection rule's actual method and context, not the label |
| Reporting | Whatever's currently cached | The device's own current state, always more current than the portal |
Nine rows, and every one of them answers a question the portal alone cannot. Learn which row a given symptom actually belongs to, and most Intune tickets stop being investigations and start being lookups.
Which layer do you find yourself jumping to first, out of habit, regardless of the ticket? For me it's almost always Layer 2, the device itself, before I've even opened the admin centre. Drop a comment below with yours.

Written by
Chetan Yamger
Cloud Engineer · AI Automation Architect · Modern Workplace Consultant
Cloud Engineer, AI Automation Architect, and Modern Workplace Consultant based in Amsterdam, Netherlands. Specializing in scalable, secure enterprise solutions with Microsoft Azure, Intune, PowerShell, and AI-driven automation using ChatGPT, Gemini, and modern LLM technologies.
Stay in the loop.
New articles, straight to you.
Deep-dive technical articles on Intune, PowerShell, and AI — no noise, no spam.
Discussion
Share your thoughts — your email stays private
Leave a comment