
From PowerShell Script to Enterprise Automation: How to Build Production-Ready Endpoint Scripts
A single script evolves through 10 concrete stages, from hardcoded and fragile to authenticated, retried, reported, and monitored in production.
This isn't a PowerShell basics article. If you've written Get-MgDeviceManagementManagedDevice before, you already know the syntax. What this post covers instead is the gap almost nobody writes about: the distance between a script that worked when you ran it once, and the same script running unattended at 3am, six months from now, with nobody watching it.
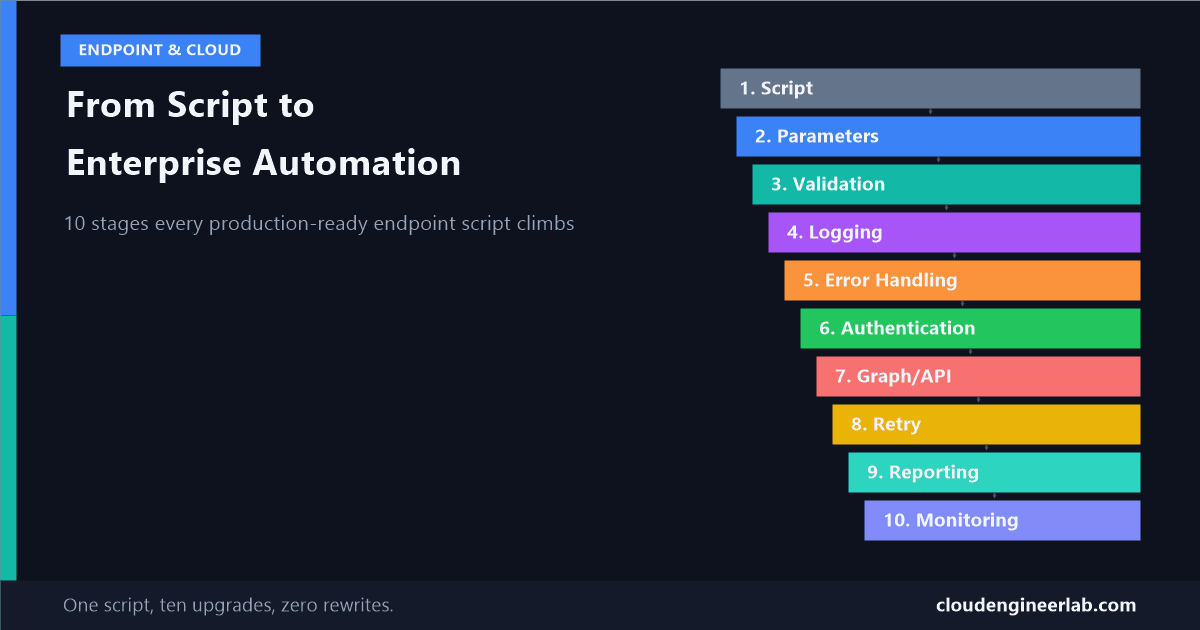
That gap has a shape. It's not one big rewrite, it's ten specific, ordered upgrades. This post takes one real script through all ten, in the order the pipeline below implies, showing exactly what breaks without each stage and what the code actually looks like once it's added.
Script
 ↓
Parameters
 ↓
Validation
 ↓
Logging
 ↓
Error Handling
 ↓
Authentication
 ↓
Graph/API
 ↓
Retry
 ↓
Reporting
 ↓
Monitoring
I've written about the individual Graph tasks and the reusable module you build once you have several scripts like this. This post is neither a task list nor a module. It's the maturity ladder a single script climbs, whether or not it ever ends up inside that module.
Stage 0: The Script Nobody Should Schedule
Every production script starts here, and that's fine, as long as it doesn't stay here. This one finds devices that haven't synced in 30 days:
Connect-MgGraph -ClientId "abc123" -TenantId "xyz789" -CertificateThumbprint "A1B2C3"

$devices = Get-MgDeviceManagementManagedDevice
$stale = $devices | Where-Object { $_.LastSyncDateTime -lt (Get-Date).AddDays(-30) }
Write-Host "Found $($stale.Count) stale devices"
$stale | Export-Csv "C:\report.csv"
It works, once, on your machine, on a tenant small enough that pagination never bites. Every problem below is invisible right up until the moment it isn't.
Stage 1: Parameters
Hardcoded values mean this script only runs correctly for the person who wrote it, on the day they wrote it. The tenant ID, the day threshold, the output path, none of that should live inside the script body.
[CmdletBinding()]
param(
    [Parameter(Mandatory)]
    [string]$TenantId,

    [Parameter(Mandatory)]
    [string]$ClientId,

    [Parameter(Mandatory)]
    [string]$CertificateThumbprint,

    [int]$DaysSinceSync = 30,

    [string]$OutputPath = "C:\Reports\StaleDevices.csv"
)
[CmdletBinding()] alone earns you -Verbose, -ErrorAction, and -WhatIf support for free. Mandatory means the script refuses to run with a silently empty credential instead of failing confusingly three lines later.
Stage 2: Validation
Parameters accept input. Validation rejects the wrong input before the script spends thirty seconds connecting to Graph and only then discovers the day threshold was negative.
[CmdletBinding()]
param(
    [Parameter(Mandatory)]
    [ValidateNotNullOrEmpty()]
    [string]$TenantId,

    [Parameter(Mandatory)]
    [ValidateNotNullOrEmpty()]
    [string]$ClientId,

    [Parameter(Mandatory)]
    [ValidatePattern('^[A-F0-9]{40}$')]
    [string]$CertificateThumbprint,

    [ValidateRange(1, 365)]
    [int]$DaysSinceSync = 30,

    [ValidateScript({ Test-Path (Split-Path $_ -Parent) })]
    [string]$OutputPath = "C:\Reports\StaleDevices.csv"
)
Fail fast, fail specific
ValidateRange(1, 365) rejects -DaysSinceSync 0 immediately with a clear parameter error. Without it, a threshold of zero silently flags every device in the tenant as stale, and you don't find out until someone asks why 4,000 devices just got reported.
Stage 3: Logging
Write-Host output disappears the moment the console closes. A script meant to run unattended needs output that survives the run and can be read later, by a human or by a monitoring system.
function Write-ScriptLog {
    param(
        [ValidateSet("Info", "Warning", "Error")]
        [string]$Level = "Info",
        [string]$Message
    )
    $Line = "$(Get-Date -Format 'o') [$Level] $Message"
    Add-Content -Path "C:\Logs\StaleDevices-$(Get-Date -Format 'yyyy-MM-dd').log" -Value $Line
    if ($Level -eq "Error") { Write-Warning $Message }
}
Building more than one of these?
This inline version is enough for a single script. If you're hardening several scripts the same way, that repeated logging function is exactly what belongs in a shared module instead, which is what the framework post builds out properly.
Stage 4: Error Handling
There are two completely different kinds of failure in this script, and treating them the same is the mistake. If Graph connection fails, nothing downstream can work, stop immediately. If one device in a loop of 4,000 has a malformed date, that's not a reason to abandon the other 3,999.
try {
    Connect-MgGraph -TenantId $TenantId -ClientId $ClientId -CertificateThumbprint $CertificateThumbprint -NoWelcome
}
catch {
    Write-ScriptLog -Level Error -Message "Graph connection failed: $($_.Exception.Message)"
    throw   # nothing below this line can succeed, so stop the script entirely
}

$staleDevices = foreach ($device in $allDevices) {
    try {
        if ([datetime]$device.LastSyncDateTime -lt $cutoff) { $device }
    }
    catch {
        Write-ScriptLog -Level Warning -Message "Skipped $($device.DeviceName): unparseable sync date"
        continue   # one bad record shouldn't kill the whole run
    }
}
Stage 5: Authentication
This is the actual line between "a script I run" and "automation." Interactive sign-in works at your desk and fails the instant nothing's there to click through an MFA prompt. Production scripts authenticate as an application, not as a person.
if ($AuthMode -eq "ManagedIdentity") {
    Connect-MgGraph -Identity -NoWelcome
} else {
    Connect-MgGraph -TenantId $TenantId -ClientId $ClientId -CertificateThumbprint $CertificateThumbprint -NoWelcome
}
I covered the actual setup for both paths, including the managed identity permission-grant step people miss the first time, in the framework post's authentication section. This is the one stage worth not re-deriving from scratch per script.
Stage 6: Graph/API
The call itself, done properly, means never trusting the default page size and never pulling more data than the task needs.
$allDevices = Get-MgDeviceManagementManagedDevice -All -Property DeviceName, LastSyncDateTime, UserPrincipalName-All here is not optional polish. Without it, this script quietly reports zero problems past device 1,000 on any tenant larger than that, with no error telling you data was cut off.
Stage 7: Retry
Graph throttles. Intune-specific endpoints throttle harder and often skip sending the Retry-After header they're supposed to include. A script with no retry logic doesn't fail occasionally, it fails on a schedule, usually whenever your tenant happens to be busiest.
function Invoke-WithRetry {
    param([scriptblock]$Action, [int]$MaxRetries = 5)
    for ($i = 0; $i -lt $MaxRetries; $i++) {
        try { return & $Action }
        catch {
            $status = $_.Exception.Response.StatusCode.value__
            if ($status -ne 429 -and $status -ne 503) { throw }
            $delay = ([Math]::Pow(2, $i) * 5) + (Get-Random -Minimum 0 -Maximum 3)
            Write-ScriptLog -Level Warning -Message "Throttled, retrying in $delay seconds"
            Start-Sleep -Seconds $delay
        }
    }
    throw "Failed after $MaxRetries retries"
}

$allDevices = Invoke-WithRetry { Get-MgDeviceManagementManagedDevice -All }
Stage 8: Reporting
This is where most scripts stop early, and it shows. Returning a raw CSV of 200 device names isn't a report, it's a data dump someone else has to turn into an answer. A real report already contains the answer.
$Report = [PSCustomObject]@{
    RunDate           = Get-Date -Format 'yyyy-MM-dd'
    TotalDevices      = $allDevices.Count
    StaleDevices      = $staleDevices.Count
    StalePercentage   = [math]::Round(($staleDevices.Count / $allDevices.Count) * 100, 1)
    TopOffenders      = $staleDevices | Sort-Object LastSyncDateTime | Select-Object -First 5 DeviceName, LastSyncDateTime
    PreviousRunDelta  = $staleDevices.Count - (Import-Csv $PreviousRunPath -ErrorAction SilentlyContinue).Count
}

$Report | ConvertTo-Json -Depth 3 | Out-File $OutputPath
A number alone isn't a report
"127 stale devices" tells a reader nothing about whether that's improving or getting worse. PreviousRunDelta costs one extra line and turns a static count into a trend, which is usually the actual question whoever reads this report is asking.
Stage 9: Monitoring
The hardest failure mode to catch isn't the script that errors, it's the script that silently never ran at all: a certificate expired, a scheduled task got disabled, an Automation Account ran out of budget. Nothing in the script itself can report a failure it never got the chance to have.
The fix is a heartbeat: something outside the script's own logic that proves the script actually completed, checked after success, not before.
# At the very end of a successful run
try {
    Invoke-RestMethod -Uri $TeamsWebhookUrl -Method POST -ContentType "application/json" -Body (@{
        text = "StaleDevices script completed: $($Report.StaleDevices) stale devices found."
    } | ConvertTo-Json)
}
catch {
    Write-ScriptLog -Level Warning -Message "Heartbeat notification failed, but the script itself succeeded"
}

exit 0
And on failure, the same webhook with a different message, plus a non-zero exit code so Task Scheduler or Azure Automation's own run history correctly shows the job as failed:
catch {
    Write-ScriptLog -Level Error -Message $_.Exception.Message
    Invoke-RestMethod -Uri $TeamsWebhookUrl -Method POST -ContentType "application/json" -Body (@{
        text = "StaleDevices script FAILED: $($_.Exception.Message)"
    } | ConvertTo-Json)
    exit 1
}
If you're shipping logs to Azure Monitor, the API changed
If your monitoring plan is to send structured logs into a Log Analytics workspace, the HTTP Data Collector API was retired on September 14, 2026. The current path is the Logs Ingestion API, authenticated through an app registration or managed identity, targeting a Data Collection Rule and Data Collection Endpoint rather than a workspace key. If you built a monitoring pipeline on the old API more than a year ago, it stopped working this month, not on some future deprecation date.
A grace period matters here too: if this script normally takes two minutes, don't page anyone the moment it hits minute three. Alert on "didn't finish within 30 minutes," not "didn't finish instantly."
The Assembled Shape
Which Stages Can You Actually Skip?
Not every script needs all ten on day one. What matters is knowing which shortcuts are genuinely fine and which ones are just delayed pain.
| Stage | Skip it for a one-off script you'll run once? | Skip it for anything scheduled? |
|---|---|---|
| Parameters | Fine to skip | Never skip |
| Validation | Usually fine to skip | Skip only if input is truly fixed and never changes |
| Logging | Fine to skip | Never skip |
| Error Handling | Risky even once | Never skip |
| Authentication | N/A, you're already signed in interactively | Never skip |
| Retry | Fine to skip | Never skip once real data volume is involved |
| Reporting | Fine to skip, read the raw output yourself | Skip only if a human reviews every run anyway |
| Monitoring | Fine to skip | Never skip |
The pattern: almost everything is legitimately optional for a script you run once, at your keyboard, watching it. The moment a script runs on a schedule with nobody watching, that same list becomes non-negotiable, because the entire point of scheduling it was to stop watching.
If you've hardened a script through all ten of these stages, which one actually caught a real production incident for you first? For most people I've talked to, it's retry logic, the throttling nobody notices until the tenant gets busy. Drop a comment below with yours.

Written by
Chetan Yamger
Cloud Engineer · AI Automation Architect · Modern Workplace Consultant
Cloud Engineer, AI Automation Architect, and Modern Workplace Consultant based in Amsterdam, Netherlands. Specializing in scalable, secure enterprise solutions with Microsoft Azure, Intune, PowerShell, and AI-driven automation using ChatGPT, Gemini, and modern LLM technologies.
Stay in the loop.
New articles, straight to you.
Deep-dive technical articles on Intune, PowerShell, and AI — no noise, no spam.
Discussion
Share your thoughts — your email stays private
Leave a comment